Fast And Curious
Jul 01, 2018
Tensorflow for Vehicles Flows.
Monitoring the traffic speed.
Using a Raspberry Pi, and a webcam, i recorded one full month of vehicles speed passing by.
The idea was to have a first experience with image classification with deep neural networks, and get some insight about the speeding behavior.
Image recording and processing
| The 247 Mercedes Benz Citaro : 110 dB, every 15 minutes |
|---|
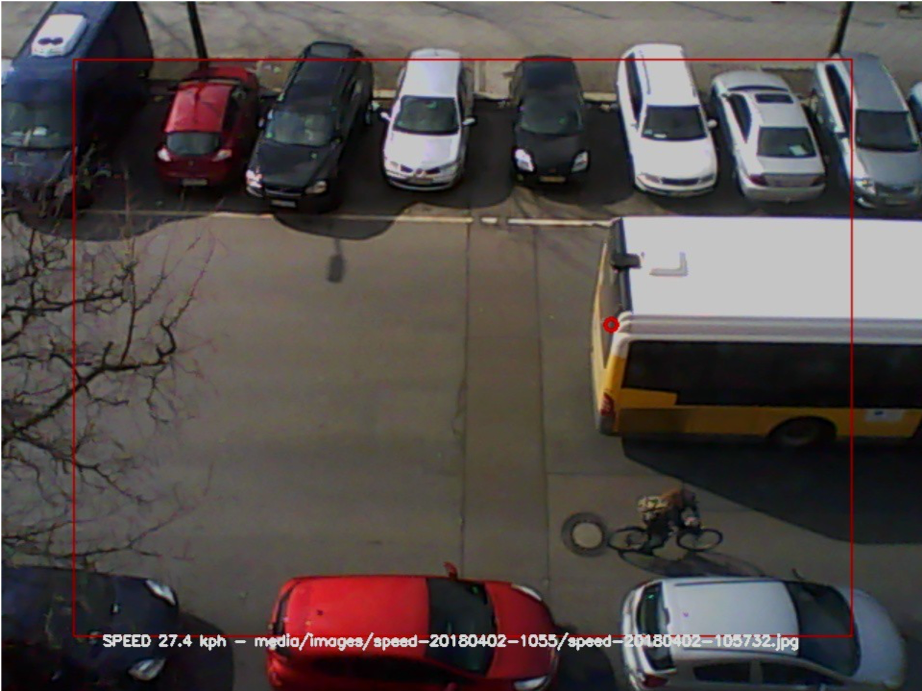 |
I used the speedcam project, an openCV based script that compute the estimated speed of moving objects, and stored the resulting pictures and speed data on a S3 instance.
The setup and calibration of the raspi with this software is well documented.
The Mechanical French
Once data are recorded (one picture per vehicle measured), we can start the classification process. Using those raw data, i labeled 20 000 pictures, with the help of a homemade product : The Mechanical French (as i could not find any opensource tool.). This labeling process took me 15 hours.
| The mechanical french, a revolutionary labelling interface. |
|---|
 |
Deep dive
Once all training pictures are labeled, we can start training a convolutional network model. For my first try, i did not use transfer learning like pretrained network. For those interested in this technique, Francois Chollet did an excellent job to explain the concept with an hands-on example here.
Although the training set has been labeled with 10 categories, i used as a matter of simplification,a binary classifier (car/bike). Indeed, the dataset is very unbalanced (few ambulances vs lots of cars)
The Network structure :
model = Sequential()
    model.add(Conv2D(32, (3, 3), input_shape=input_shape))
    model.add(Activation('relu'))
    model.add(MaxPooling2D(pool_size=(2, 2)))
    model.add(Conv2D(32, (3, 3)))
    model.add(Activation('relu'))
    model.add(MaxPooling2D(pool_size=(2, 2)))
    model.add(Conv2D(64, (3, 3)))
    model.add(Activation('relu'))
    model.add(MaxPooling2D(pool_size=(2, 2)))
    model.add(Flatten())
    model.add(Dense(64))
    model.add(Activation('relu'))
    model.add(Dropout(0.5))
    model.add(Dense(nb_category))
    model.add(Activation('sigmoid'))
With a low-end graphic card, the model training takes 2 hours and has a 97% accuracy.
Finally, using this classifier built from scratch, we can sort all the pictures.
Results
This is the overall vehicle flow in the street for a full month. The first days suffered from a faulty usb cable on the rasperry pi. At the end, i forgot to plug it in the morning after using it to charge my phone.
| Bikes vs Cars |
|---|
 |
| Average speed (km/h) during a day |
|---|
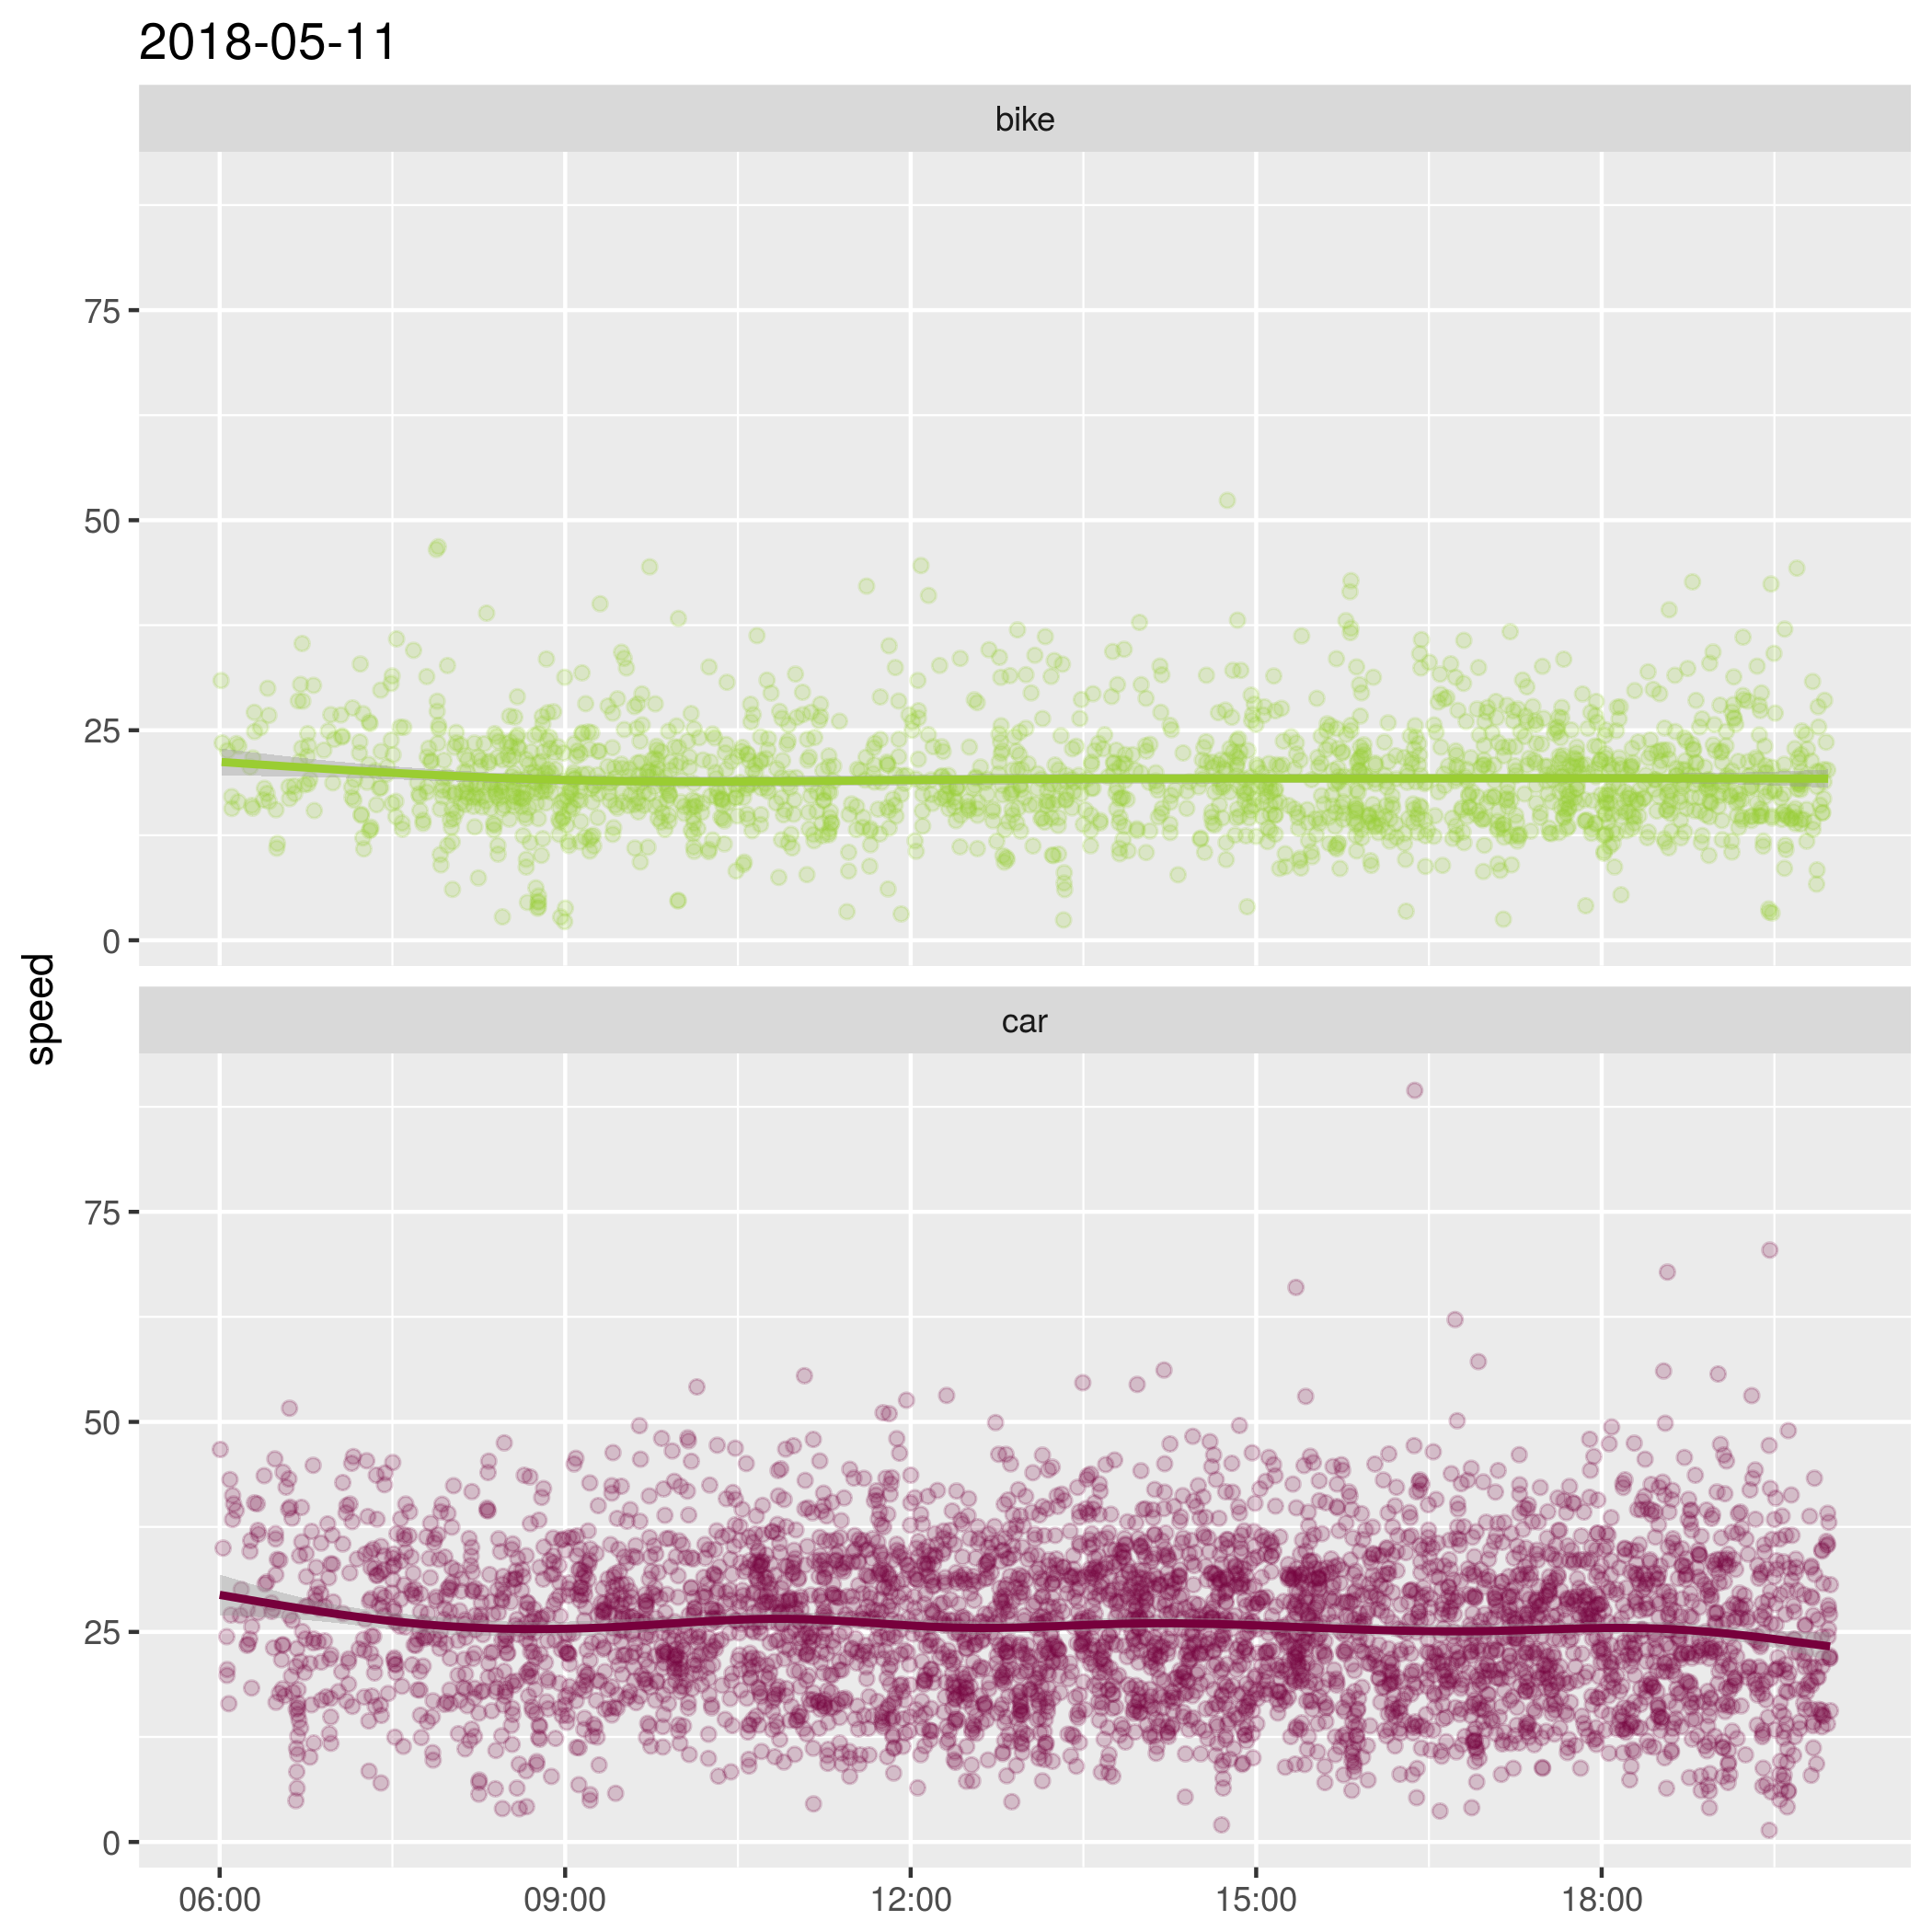 |
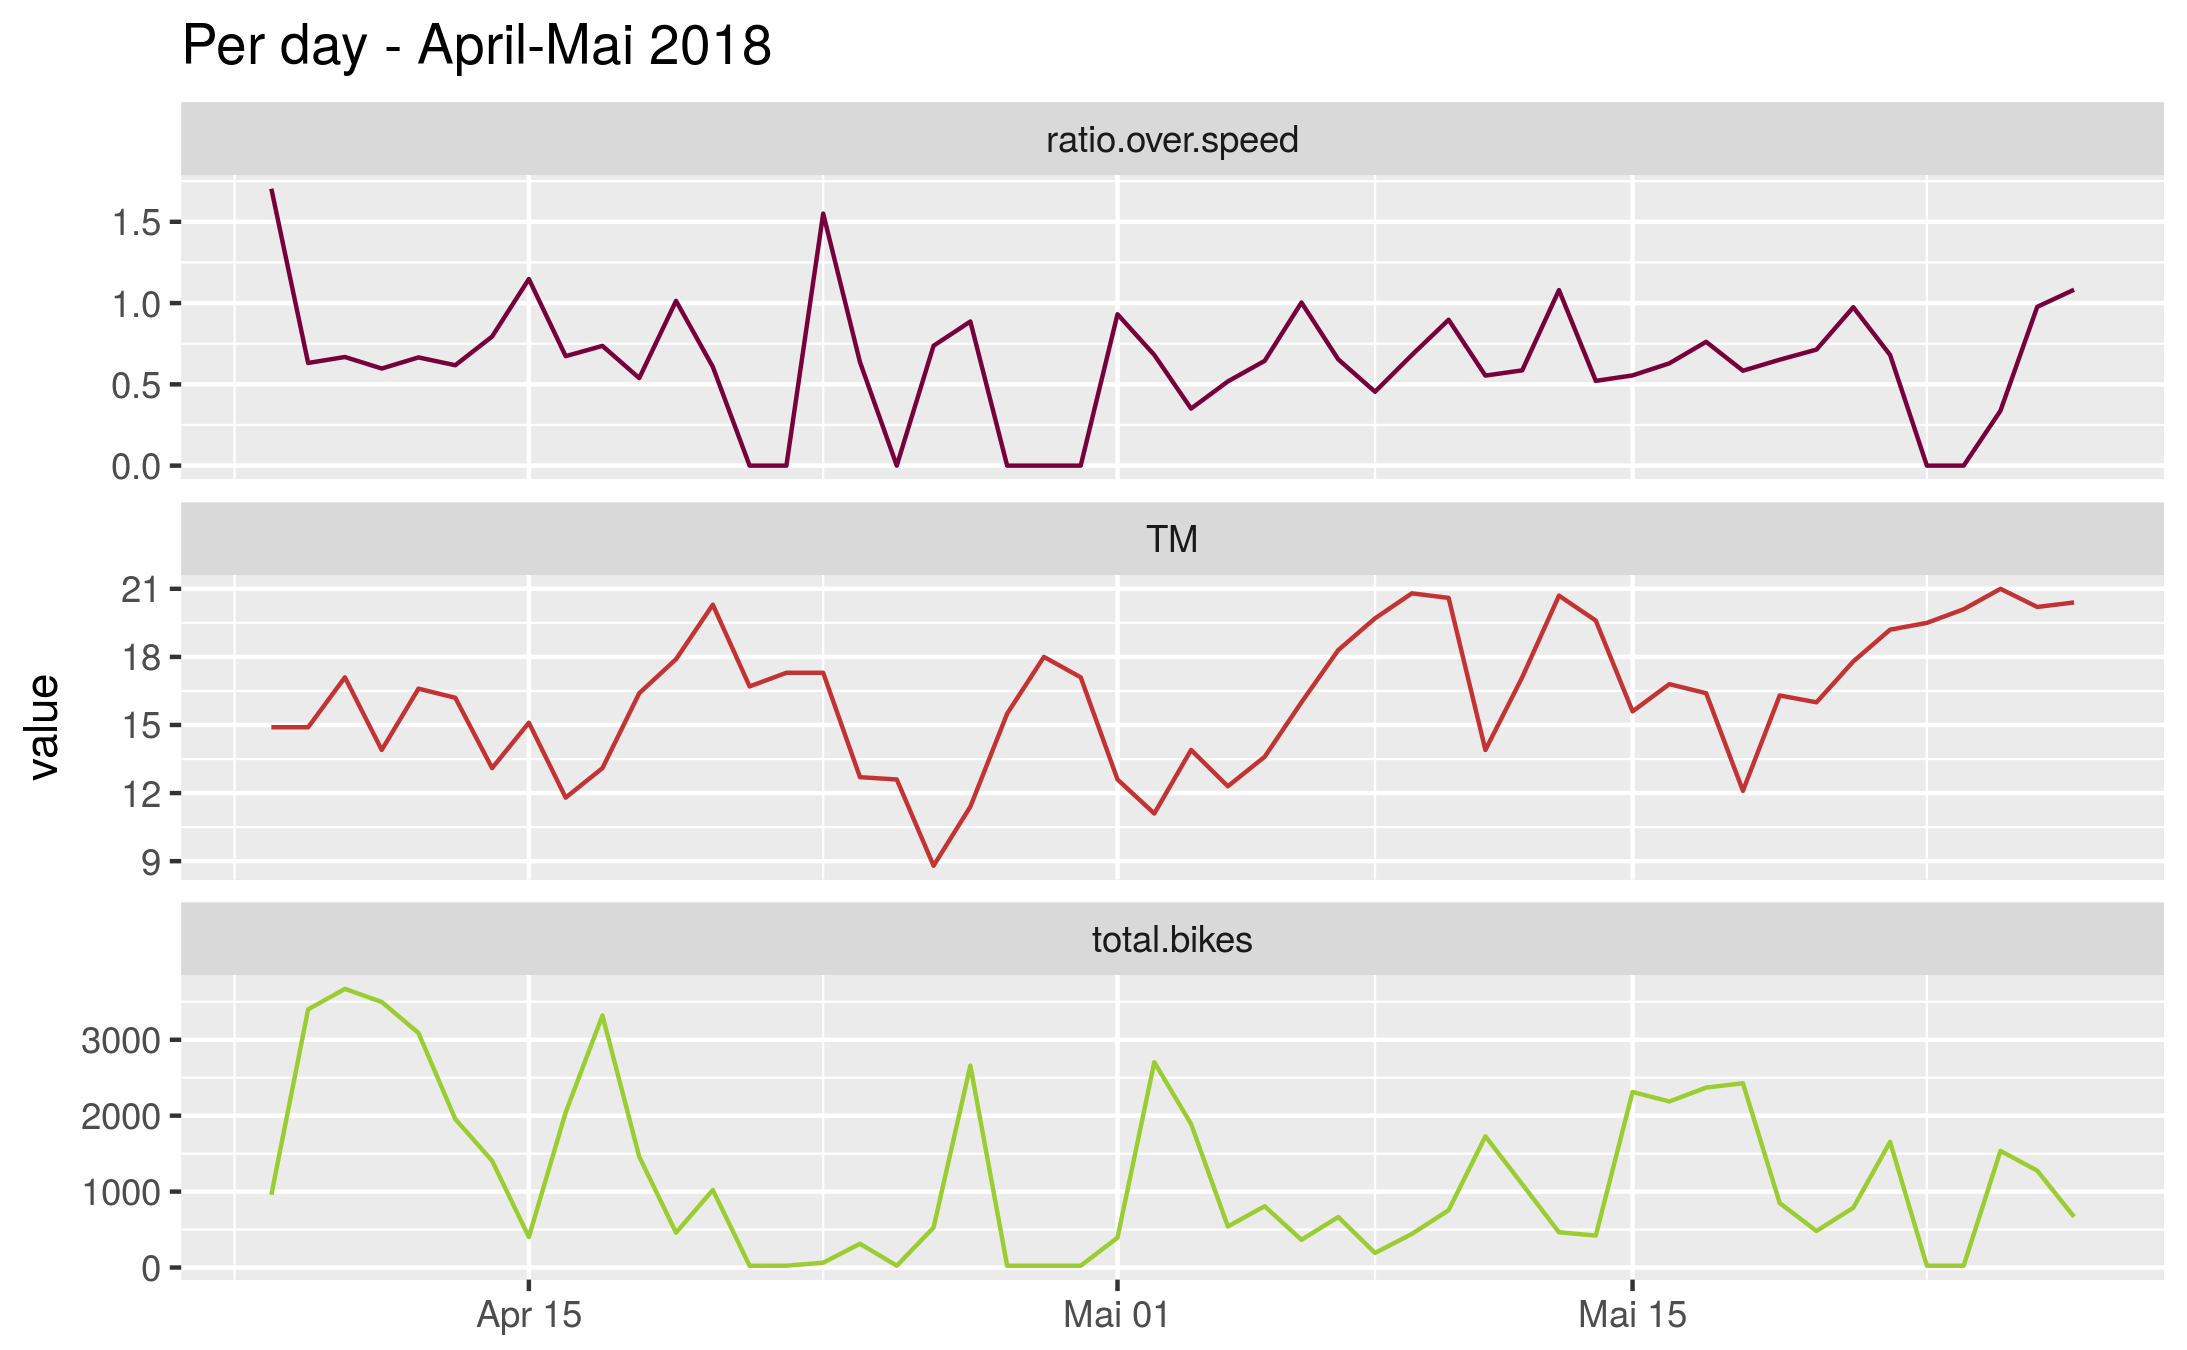
There does not seem to give any correlation between the mean temperature (TM) or the bikes flow and the number of speeding.
| Mean Temperature vs Speeding vs Bikes flow |
|---|
 |
| Speeding heatmap |
|---|
 |
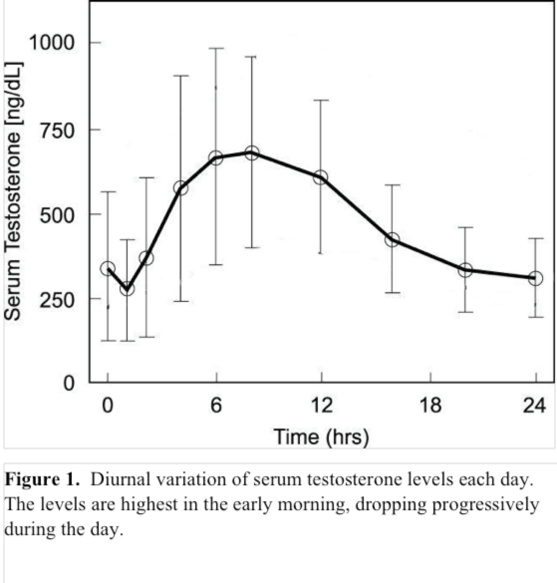
One hypothesis : the speedings occur more often early in the morning or beginning of the after noon, which match with the male testosteron variation in the day. Sunday (low traffic) amplifies this trend.
| Source : Random Google |
|---|
 |
Share